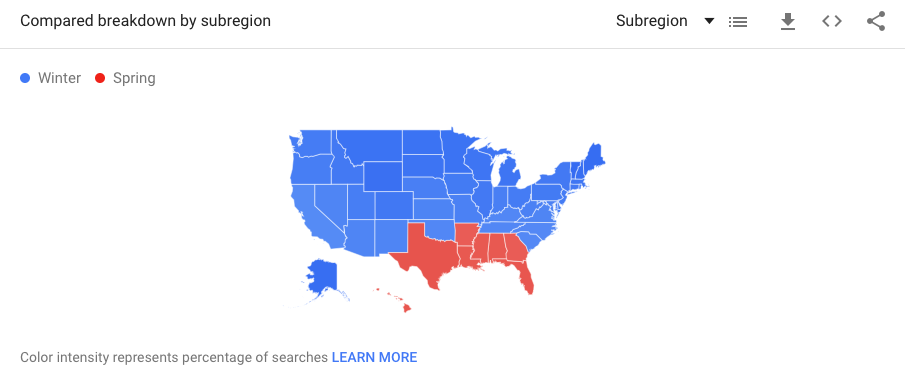
The topics I chose to compare on Google Trends were “Winter” and “Spring”. My reason for choosing these two topics is because we are currently still in winter, yet I wanted to know if since spring is approaching, which was being searched more.
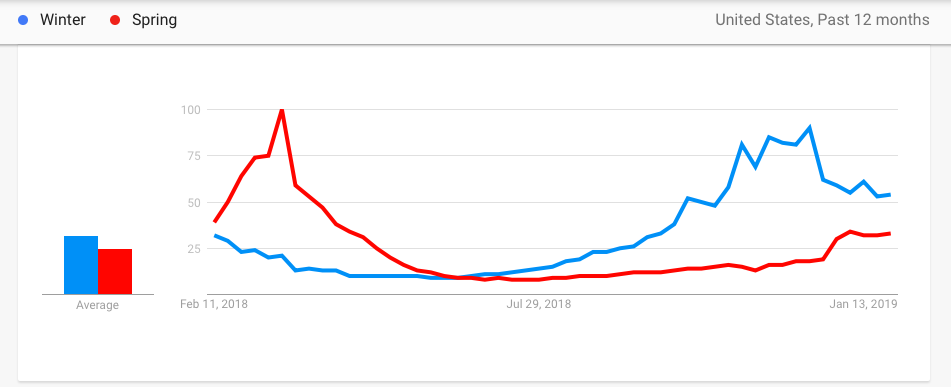
What I noticed when analyzing this graph were results I had already predicted. Spring was being search a lot more than winter in the last few months of the winter season. I am assuming this was built up and a result of the excitement in winter ending. However, during summer months, both seem to drop significantly. Then once December hits, winter skyrockets up to being very popular. I can assume this is from the holiday season and everyone wanting to be in the spirit. I did notice that the topic of winter stays relatively high through January. I am assuming this is because of the severe winter storms certain states have and the searches they make to be informed about the weather. When using my iPhone to search “winter”, my iPhone tells me the official dates of winter starting and end date. I notice that they dates fall relatively in that steady up and down streak in the graph above. Same with searching “spring” with my voice search. However, they start and end dates fall within the range of the peak. When I use a regular search engine search of the term “winter” or “spring” I received the winter start and end date specifically in the northern hemisphere and EST. This is because of my location services that are on in my settings for safari. Marketers can use this tactic because they can see in which parts of the world (such as hemisphere) that searches will be more popular than others. For example, this graph below really showed me in which parts of the world each season was more relevant in.